Nov
24
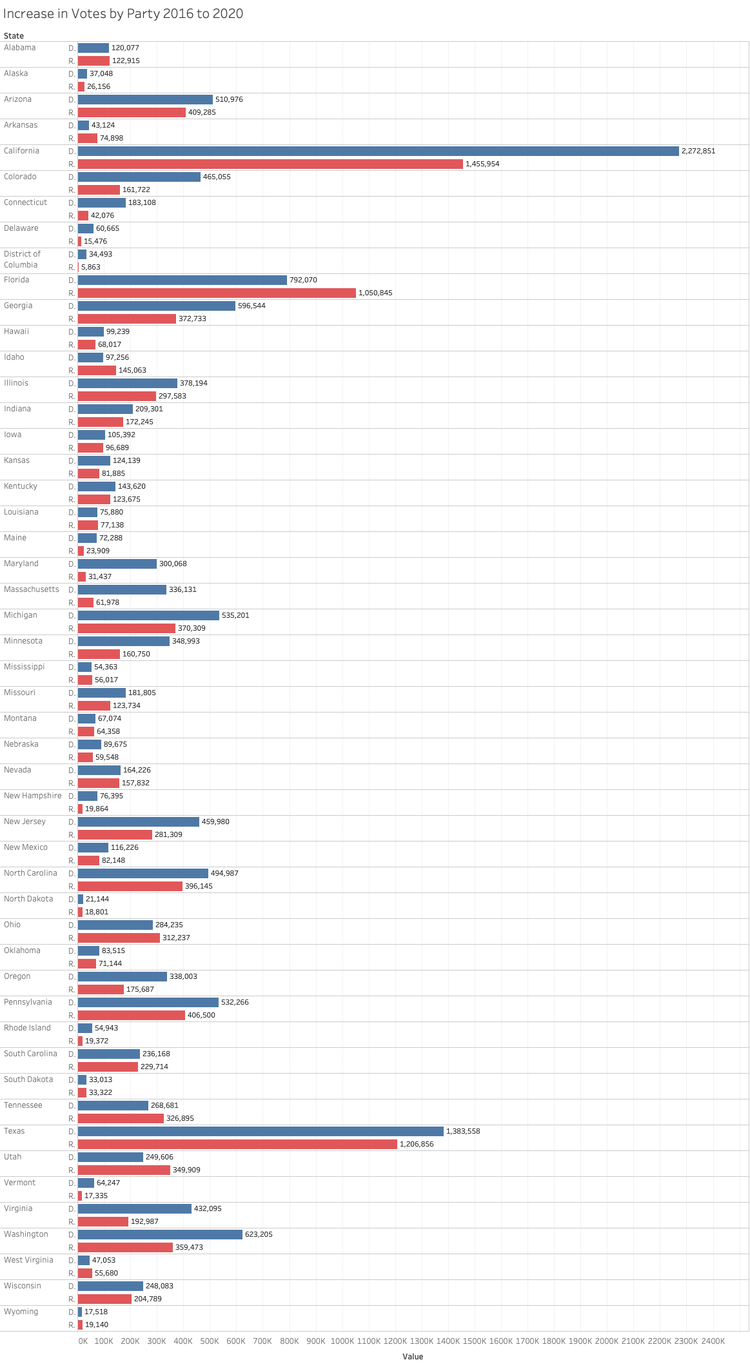
Both Parties Got More Votes This Year, That’s a Challenge for Visualizing Results
Often, visualizations about election data focus on the margin of victory (the gap between a winner and loser) and share (what percent of…
5 min read